Postgres Query Plan Visualization
January 19th, 2016
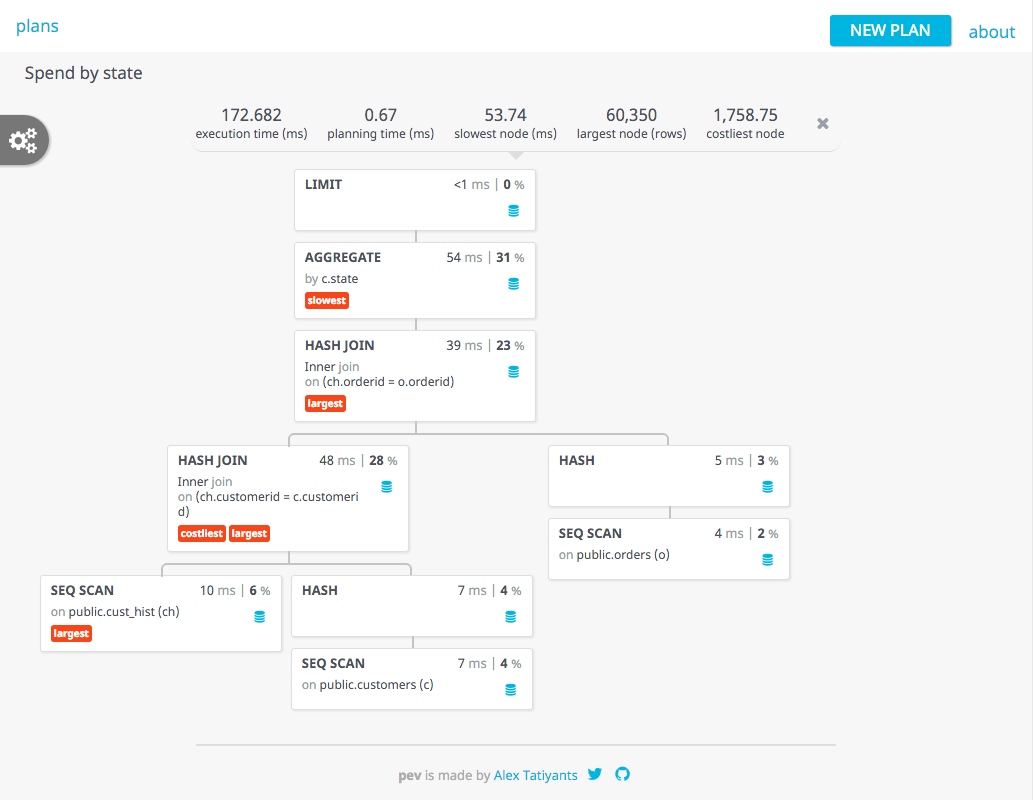
After a recent stint in query optimization, I once again found myself wanting a better way to view query plans produced by EXPLAIN. So, I finally decided to do something about it and the result is Postgres EXPLAIN Visualizer (or Pev):
Why Pev
I wanted a tool that can make plans simple to understand and be visually pleasing. More specifically, I wanted:
- minimal visual noise
- insights
- high degree of customization
- plan in context of the query
Let’s see how Pev helps with these. I’ll use the plan produced by the query below for illustration (you can run this query against the dellstore2 database):
SELECT C.STATE,SUM(O.NETAMOUNT), SUM(O.TOTALAMOUNT)
FROM CUSTOMERS C
  INNER JOIN CUST_HIST CH ON C.CUSTOMERID = CH.CUSTOMERID
  INNER JOIN ORDERS O ON CH.ORDERID = O.ORDERID
GROUP BY C.STATE
  LIMIT 10 OFFSET 1
I should also note that Pev only works with EXPLAIN Plans in JSON format. To produce one, use this code:
EXPLAIN (ANALYZE, COSTS, VERBOSE, BUFFERS, FORMAT JSON)
Node Visualization
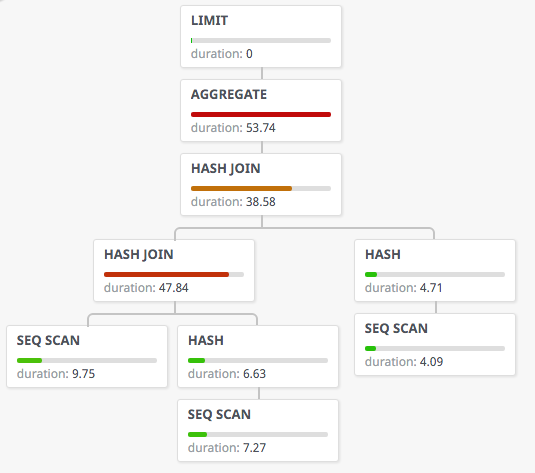
First off, Pev uses a classic tree graph to visualize the plan. I find this to be easier to view than the left-to-right tree used by PgAdmin:
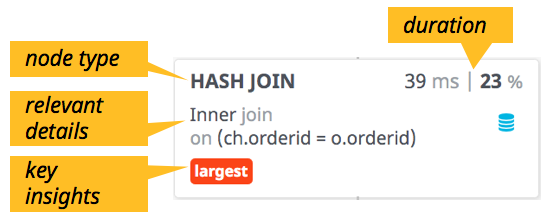
By default, each node displays its type + relevant details (like the object being scanned or the join condition), duration, and key insights (like whether this node is some type of outlier):
Speaking of insights, Pev currently calculates the following:
– outlier nodes (largest, slowest, costliest)
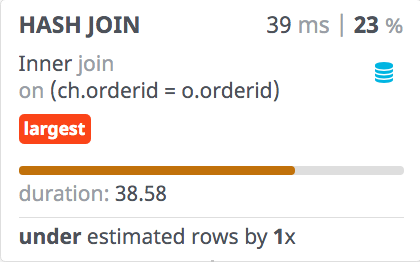
– nodes with bad planner estimates (planner missed by a factor of 100 or more)
Pev also allows for various customizations, like showing planner estimate details and a graph of either rows, duration, or cost:
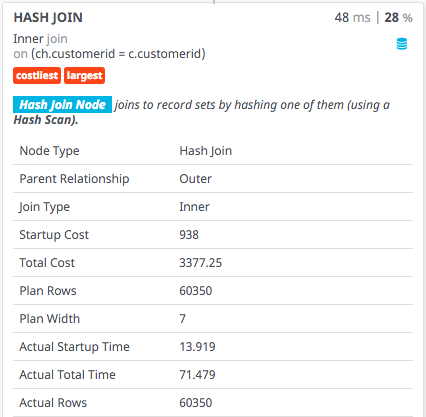
If you want to see absolutely everything Postgres knows about the node, just click on the title to get the extended view:
Using these customizations (available in the settings menu on the left), you can easily create graphs like the one below which shows how fast each node is:
Query Display
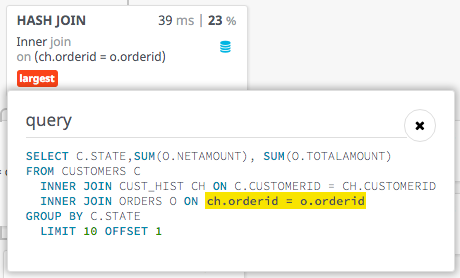
I personally find it hard to mentally map the plan I’m seeing to the query that generated it. Pev helps in this regard by showing you the query right next to your node and highlighting the relevant part wherever possible. Just click the little blue database icon inside the node:
I must admit that highlighting the relevant part of the query is quite rudimentary at this point, but I’m hopeful that it can be improved in the future.
Two more things
Pev is heavily influenced by the excellent explain.depesz.com. I learned a lot about how Postgres planner works from using it and reading the help.
If you do use Pev, please let me know how you like it at @alexTatiyants. If you want to make it better, the code is on github.
You may also like:
Did you love / hate / were unmoved by this post?
Then show your support / disgust / indifference by following me on
Twitter!

This post got 19 comments so far. Care to add yours?
[…] From: http://tatiyants.com/postgres-query-plan-visualization/ […]
[…] PEV: PostgreSQL Query Plan Visualisation […]
Tried to use it, but got JS errors after clicking SUBMIT btn: https://www.dropbox.com/s/f20koihhmags6gn/Screenshot%202016-01-24%2011.16.10.png?dl=0
Can you please submit the JSON you used on gitHub? thanks
This seems to be an issue specific to Safari. I experience the same issue when using Safari, but not in Chrome.
I put the dellstore on github for others convenience https://github.com/morenoh149/postgresDBSamples/tree/master/dellstore2-normal-1.0
thank you very much, that’s helpful
JS error
Uncaught EXCEPTION: Error during evaluation of “click”
ORIGINAL EXCEPTION: SyntaxError: Unexpected token L
ORIGINAL STACKTRACE:
SyntaxError: Unexpected token L
at Object.parse (native)
at a.createPlan (http://tatiyants.com/pev/bundles/app.js:2:5722)
at a.submitPlan (http://tatiyants.com/pev/bundles/app.js:2:8889)
at e.ChangeDetector_a_0.handleEventInternal (eval at (http://tatiyants.com/pev/lib/angular2.min.js:1:0), :584:35)
at e.handleEvent (http://tatiyants.com/pev/lib/angular2.min.js:6:21391)
at e.dispatchEvent (http://tatiyants.com/pev/lib/angular2.min.js:7:6036)
at e.dispatchRenderEvent (http://tatiyants.com/pev/lib/angular2.min.js:7:5906)
at t.dispatchRenderEvent (http://tatiyants.com/pev/lib/angular2.min.js:5:30935)
at o (http://tatiyants.com/pev/lib/angular2.min.js:7:14521)
at http://tatiyants.com/pev/lib/angular2.min.js:7:14856
ERROR CONTEXT:
[object Object]
can you please submit this as an issue on gitHub along with the JSON you used?
[…] Articolo Originale: http://tatiyants.com/postgres-query-plan-visualization/ […]
Pasted SQL / EXPLAIN and name… click SUBMIT….nothing happened. Ctrl-F5 and repeat.. nothing happens…!
can you please submit this on gitHub along with the JSON / sql you were using? thanks
[…] Postgres Explain Visualizer (Pev) is a tool I wrote to make EXPLAIN output easier to grok. It creates a graphical representation of the query plan. […]
[…] POSTGRES QUERY PLAN VISUALIZATION […]
On the first diagram, sum of all the percentages is 101%
Haha, Good catch! It’s due to rounding.
[…] Postgres Query Plan Visualization […]
Hello,
My organization is not comfortable with us utilizing your hosted version of this (even though I have tried and failed to explain that it only stores data locally).
I am not fairly knowledgeable with web development, etc, but would like to host a local version of this tool. Would anyone be able to provide some concise instructions for setting this up to be hosted on a windows-based VM?
Thanks,
~CW
I’m sorry to hear about your predicament. To use Pev locally, you need to build it with npm (instructions are on my (gitHub page). As far as setting up a Node VM on windows, here’s one tutorial.