How to Customize JFree Charts
July 31st, 2014
JFree Chart is an open-source charting library for the JVM. It’s been around forever, it’s got a ton of options, and it’s capable of generating some really great charts.
That said, it’s default output is not great. There’s a fair amount of visual noise and default color choices could be better. So, in this tutorial, I’ll explain how to customize your JFree chart to look clean and modern.
1. Generate Basic Chart
We’ll start by generating a simple bar chart:
Integer width = 500, height = 300

JFreeChart chart = ChartFactory.createBarChart(
    "",                         // chart title
    "",                         // domain axis label
    "",                         // range axis label
    createDataset(),            // data
    PlotOrientation.VERTICAL,   // orientation
    true,                       // include legend
    true,                       // tooltips?
    false                       // URLs?
)

ChartRenderingInfo info = new ChartRenderingInfo(new StandardEntityCollection())
ChartUtilities.saveChartAsPNG(new File("bar-chart.png"), chart, width, height, info)
This is what the output looks like:
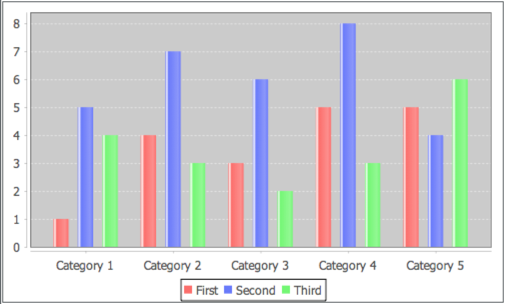
Though it’s not terrible, there are a few issues:
- unnecessary borders for both the overall chart, the plot area, and the label
- unnecessary gradient fill for the bars
- unnecessary gray plot background
- default color scheme is not aesthetically pleasing (at least to my eye)
- legend values are smushed together
So, let’s fix that shall we?
2. Format the Plot Area
Let’s start by cleaning up the plot area. In particular, let’s get rid of various lines as well as that background gray:
CategoryPlot plot = chart.categoryPlot
plot.backgroundPaint = Color.white
plot.domainGridlinePaint = Color.white
plot.rangeGridlinePaint = Color.white
plot.outlineVisible = false
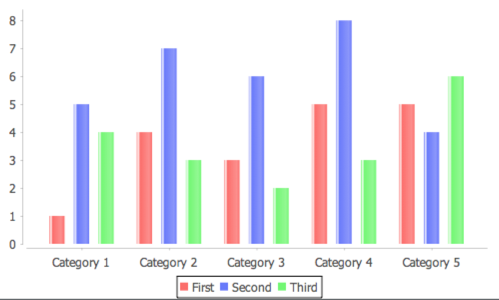
This is what the chart now looks like:
3. Format the Bars
Next, let’s make the bars look nicer. We’ll remove the gradient change the default colors:
// remove the gradient fill
plot.renderer.gradientPaintTransformer = null
plot.renderer.barPainter = new StandardBarPainter()

Paint[] colors = [
    new Color(0, 172, 178),      // blue
    new Color(239, 70, 55),      // red
    new Color(85, 177, 69)       // green
]

// change the default colors
for (int i = 0; i < 4; i++) {
    plot.renderer.setSeriesPaint(i, colors[i % colors.length])
}
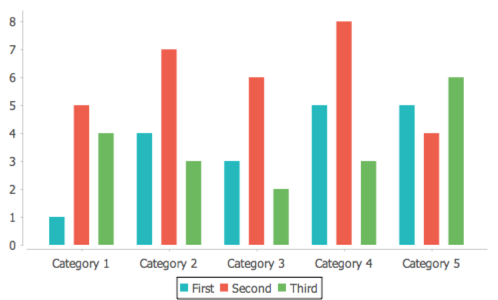
Our chart now looks like this:
4. Format the Legend
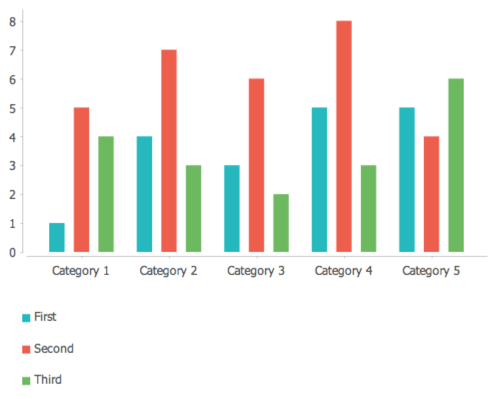
The next item on our hit list is the legend. There are many ways one can format the legend, but I’m going to focus on (1) removing the border and separating it with extra padding and (2) giving each item its own line. Note that the second fix will require us to increase the height of the chart (In my example I’ll increase it from 300px to 400px).
Here’s the code:
chart.legend.frame = BlockBorder.NONE
chart.legend.itemLabelPadding = new RectangleInsets(5.0, 2.0, 10.0, width)
chart.legend.padding = new RectangleInsets(20.0, 20.0, 0.0, 0.0)
Although there doesn’t appear to be an option to automatically put legend items on separate lines, there’s a trick you can use. The trick is to set the right padding to something large, like the width of the chart.
Ok, here’s what our chart now looks like:
5. Remove Even More Clutter
For the final step, I will simplify the chart even more by getting rid of the range (Y) axis and putting value labels directly on the bars. Furthermore, I will make the category labels less pronounced.
// add values to bars
plot.renderer.baseItemLabelGenerator = new StandardCategoryItemLabelGenerator()
plot.renderer.baseItemLabelsVisible = true

// hide y axis
NumberAxis rangeAxis = (NumberAxis) plot.rangeAxis
rangeAxis.visible = false

// format the x axis
CategoryAxis domainAxis = plot.domainAxis
domainAxis.tickLabelPaint = new Color(160, 163, 165)
domainAxis.categoryLabelPositionOffset = 4
domainAxis.lowerMargin = 0
domainAxis.upperMargin = 0
domainAxis.categoryMargin = 0.2
And here’s the final chart:

You may also like:
Did you love / hate / were unmoved by this post?
Then show your support / disgust / indifference by following me on
Twitter!
This post got one comment so far. Care to add yours?
[…] Artigo traduzido pela Redação iMasters, com autorização do autor. Publicado originalmente em http://tatiyants.com/how-to-customize-jfree-charts/ […]